Wazuh → Splunk Integration



What this project is
This project connected Wazuh and Splunk together.
- Wazuh watched my Ubuntu server and created security alerts.
- Splunk received those alerts so I could search and analyze them.
Simple explanation:
Wazuh finds alerts. Splunk helps me search the alerts.
This is a basic SOC workflow. A SOC analyst needs to collect security data, search it, and understand what happened.
Tools used
- Ubuntu Server: The machine being monitored.
- Wazuh Agent: Watched the Ubuntu server for activity.
- Wazuh Manager: Processed the activity and created alerts.
- Splunk Universal Forwarder: Sent Wazuh alerts from Ubuntu to Splunk.
- Splunk Enterprise: Stored and searched the alerts.
- Windows Host: Ran Splunk Enterprise and received logs on port
9997.
How it works
Ubuntu Server
   ↓
Wazuh detects activity
   ↓
Wazuh writes alerts to alerts.json
   ↓
Splunk Universal Forwarder sends the alerts
   ↓
Splunk receives the alerts
   ↓
I search the alerts in Splunk
What I did
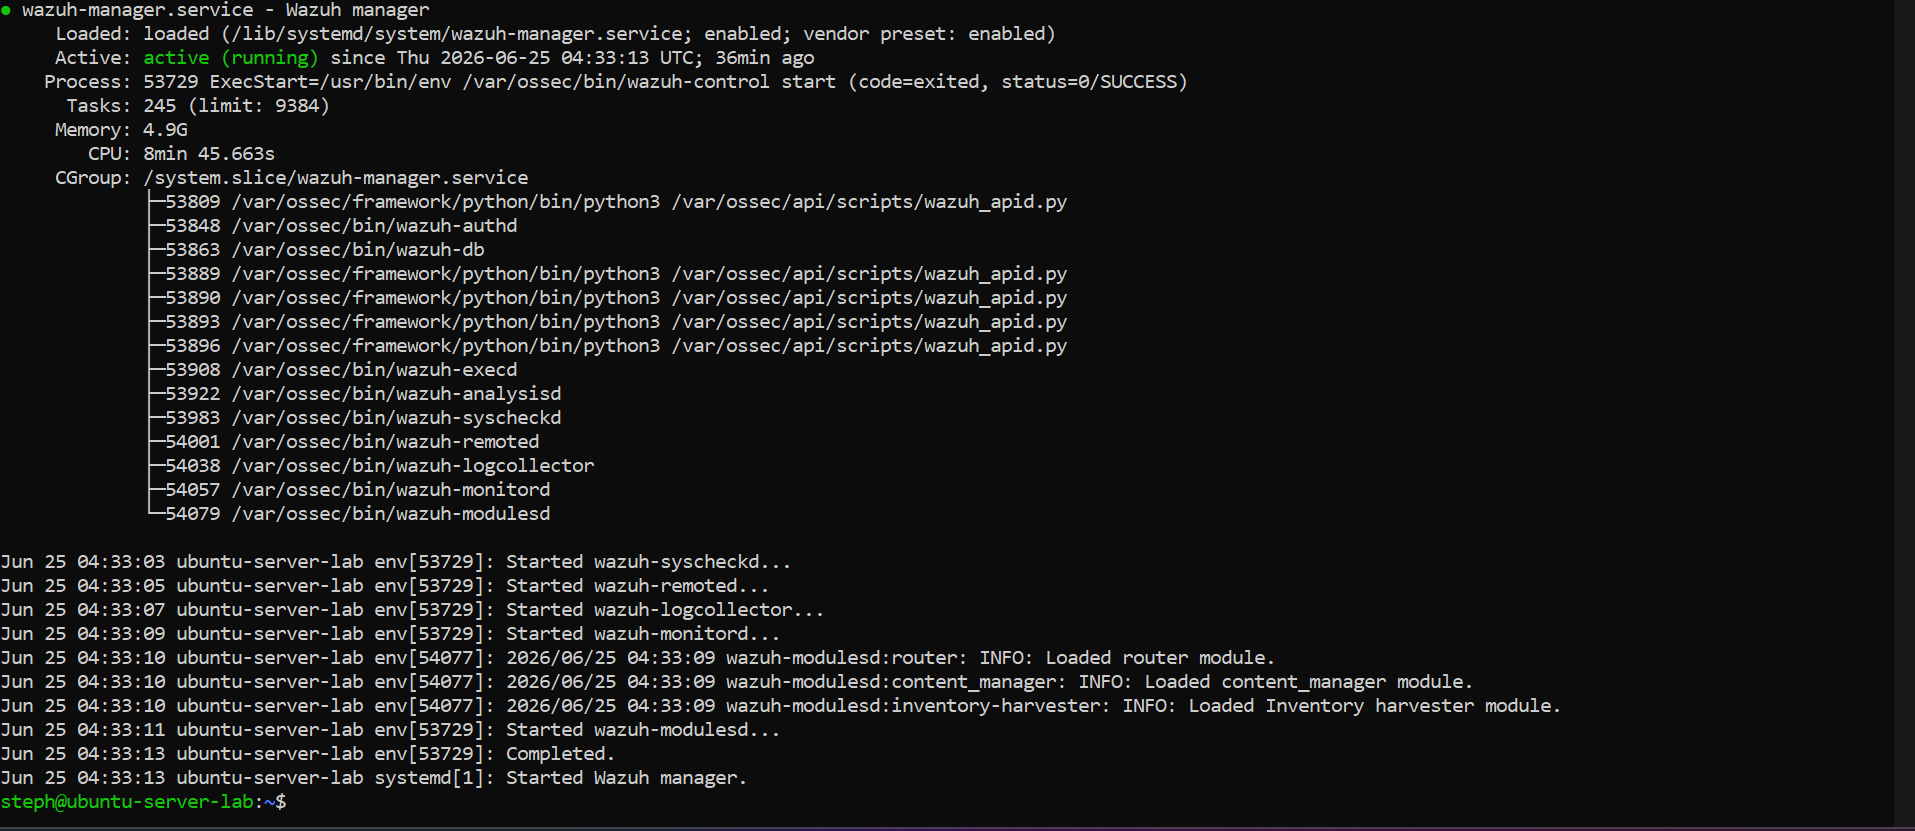
- Confirmed the Wazuh Manager was running on Ubuntu.
- Installed the Wazuh Agent on the Ubuntu server.
- Confirmed the Wazuh Agent was active.
- Installed the Splunk Universal Forwarder on Ubuntu.
- Created a Splunk receiving port on
9997. - Created a Splunk index named
wazuh. - Forwarded this Wazuh alert file into Splunk:
/var/ossec/logs/alerts/alerts.json
- Created safe test activity so Wazuh would generate alerts.
- Searched Splunk to confirm the alerts arrived.
How I created test alerts
At first, there were not many alerts because my Ubuntu server was quiet.
That helped me understand something important:
No activity means no alerts.
To test the setup safely, I created simple activity on Ubuntu, like failed sudo attempts. This caused Wazuh to generate alerts.
Then I checked the Wazuh alert file:
sudo tail -n 20 /var/ossec/logs/alerts/alerts.json
After that, I searched for the alerts in Splunk.
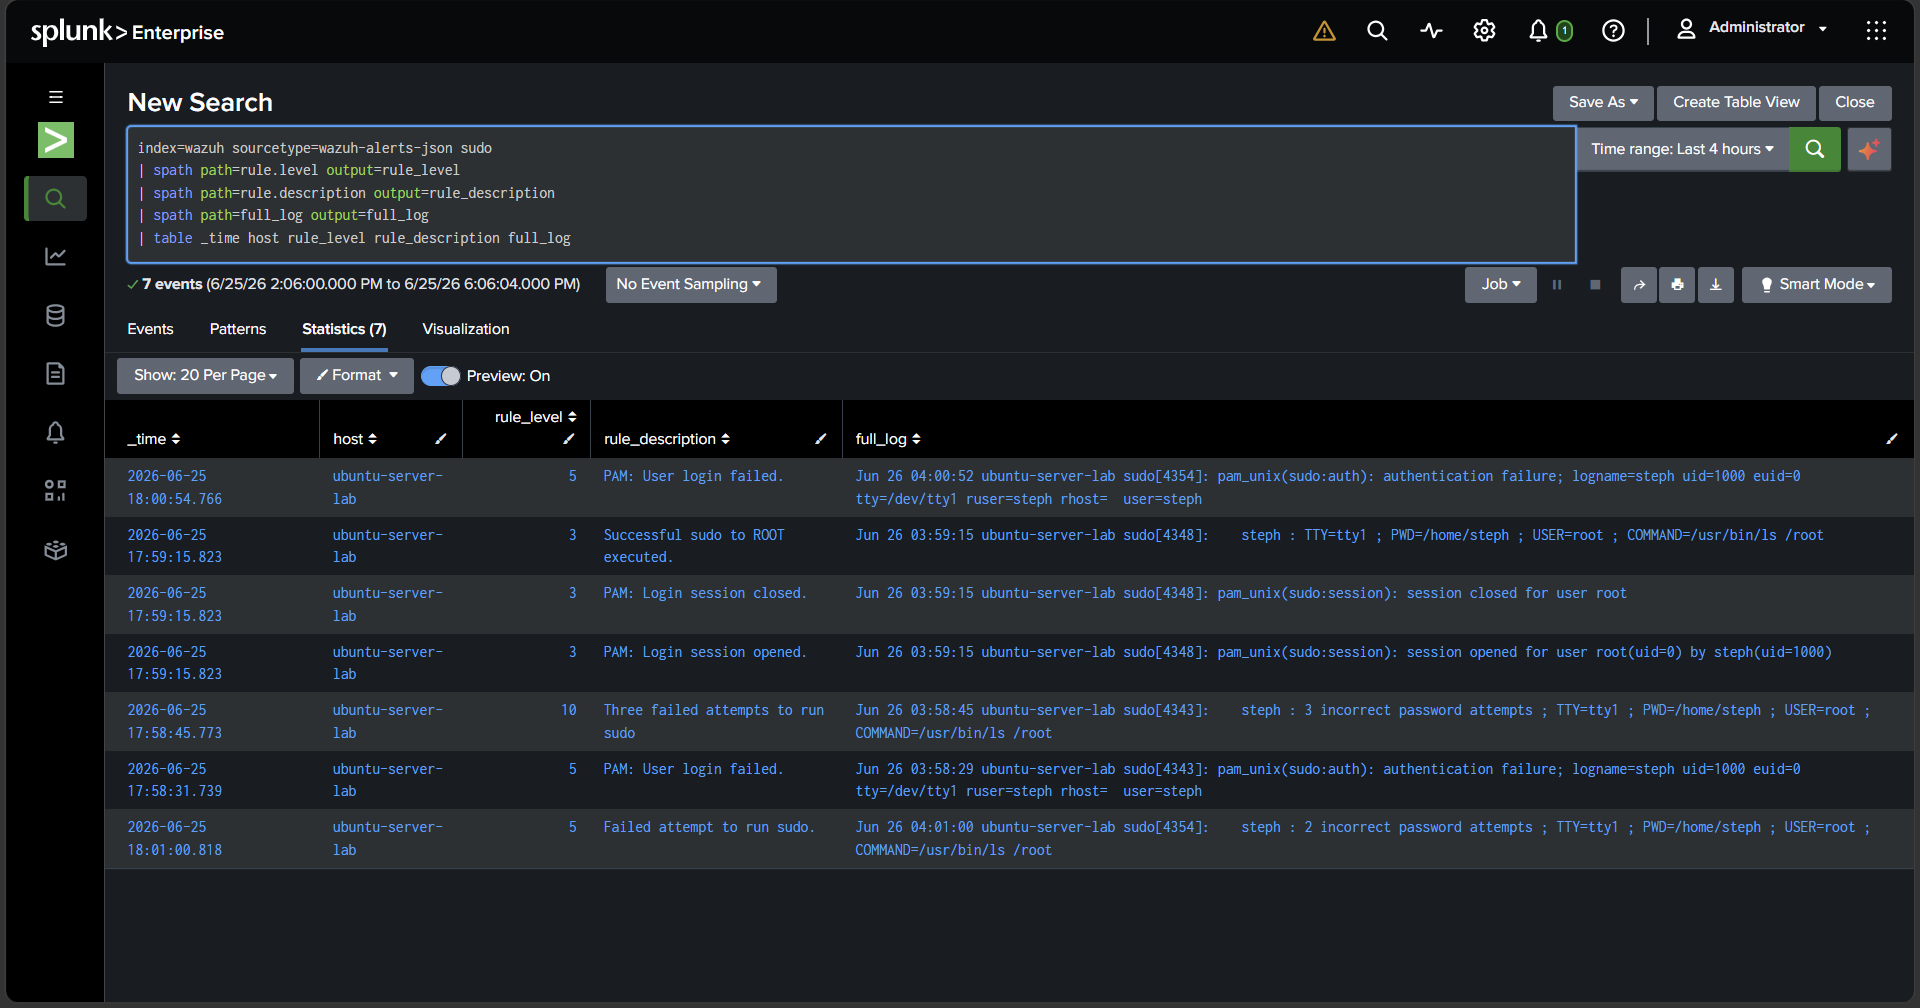
Splunk searches I used
Show Wazuh events:
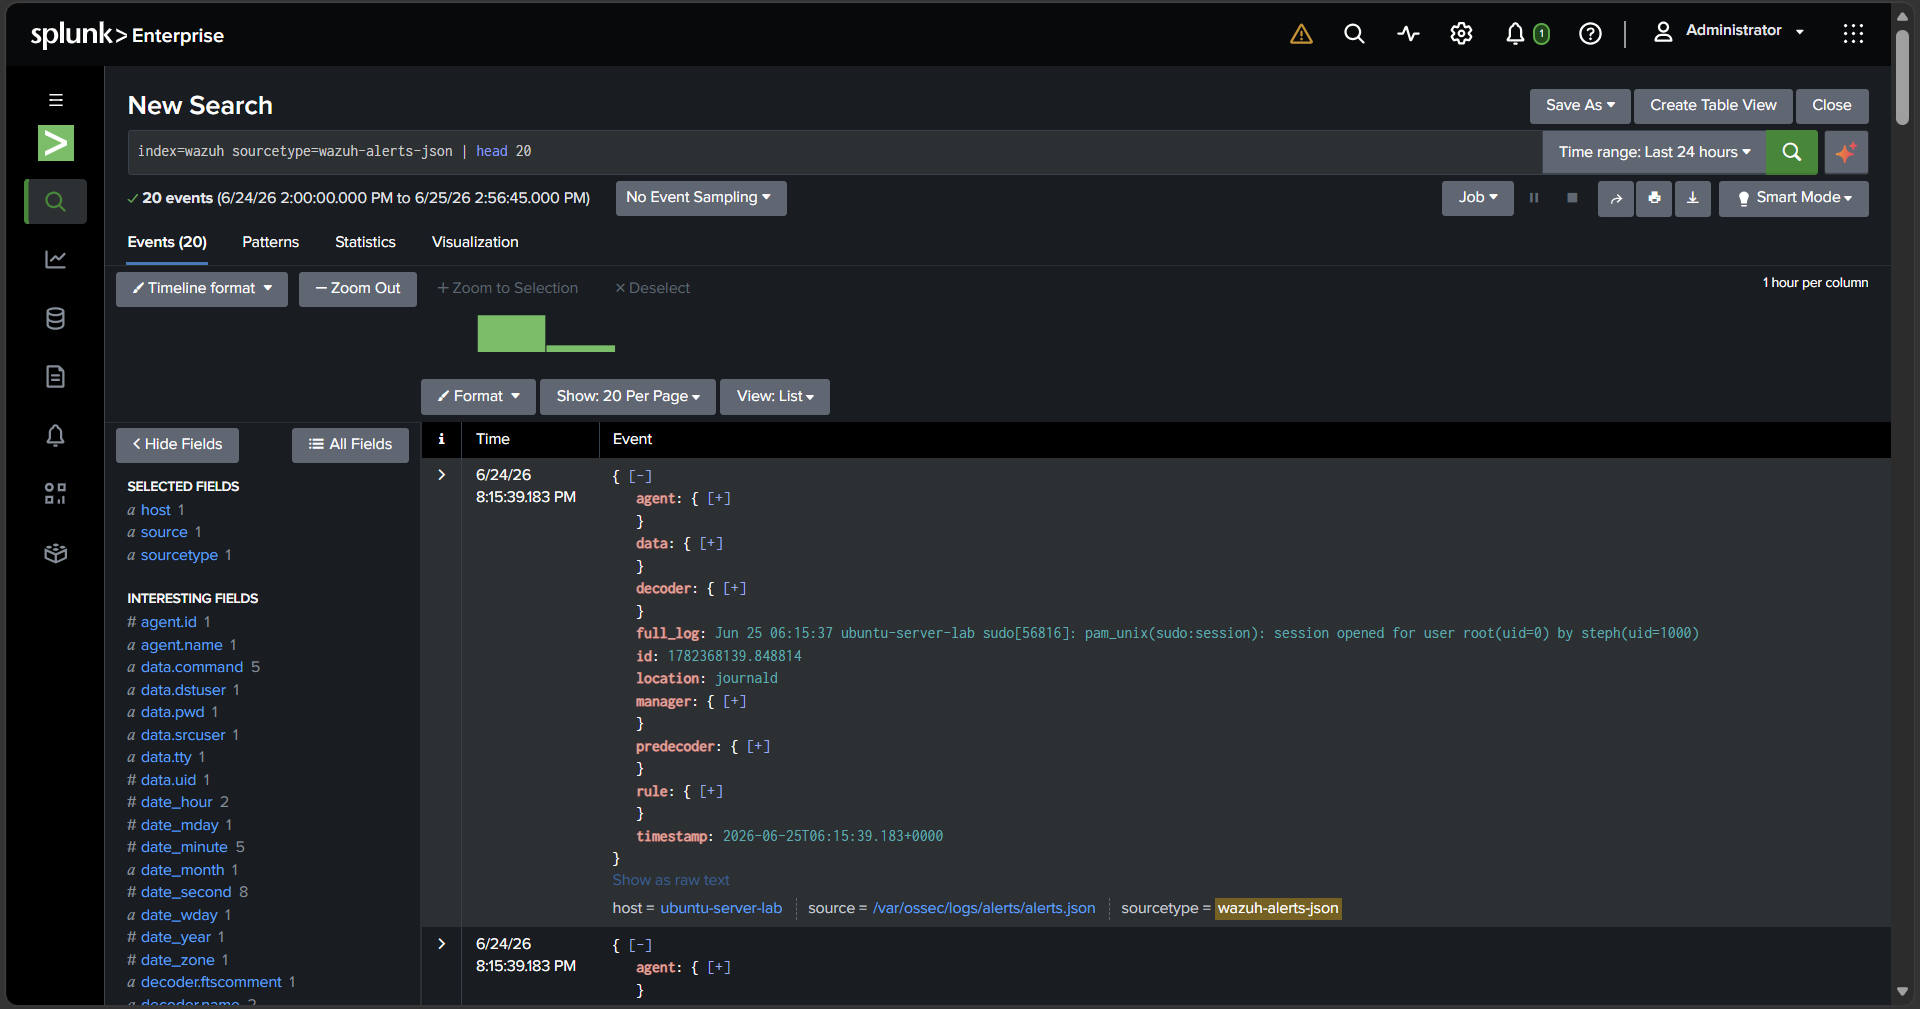
index=wazuh | head 20
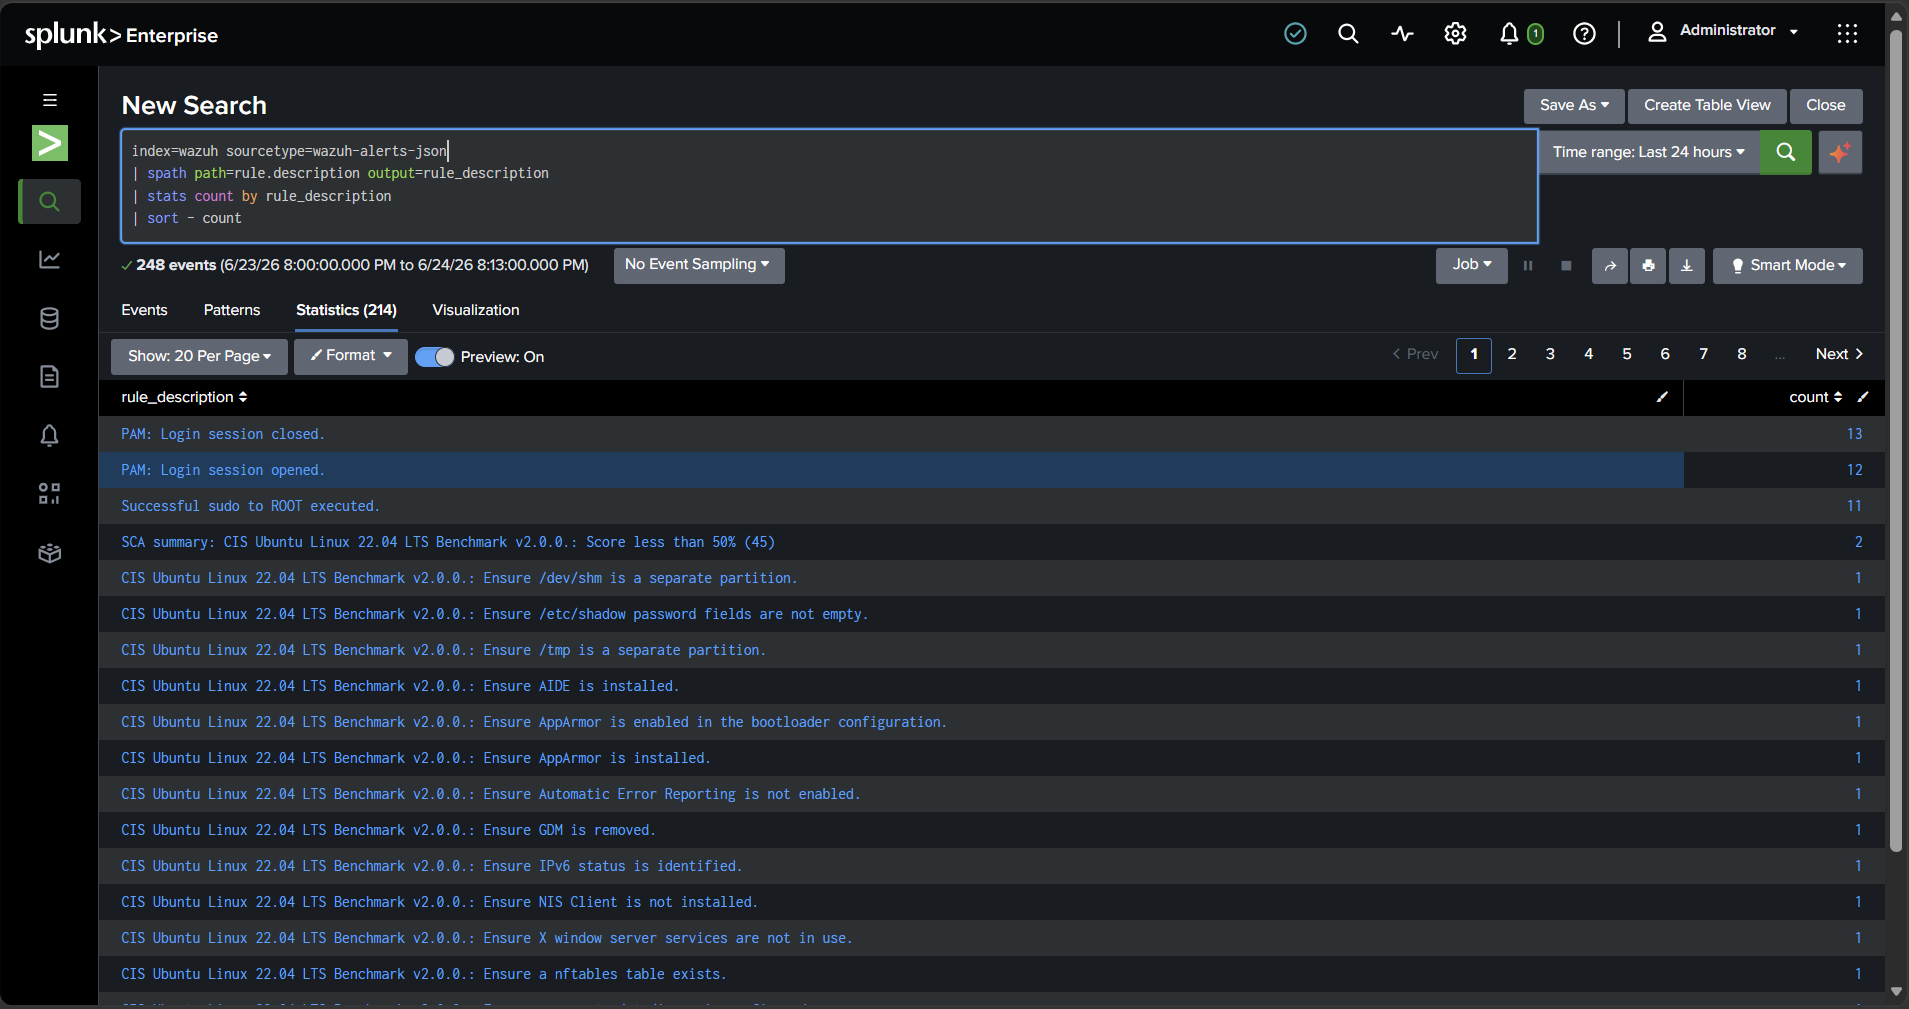
Count alerts by rule description:
index=wazuh | stats count by rule.description | sort -count
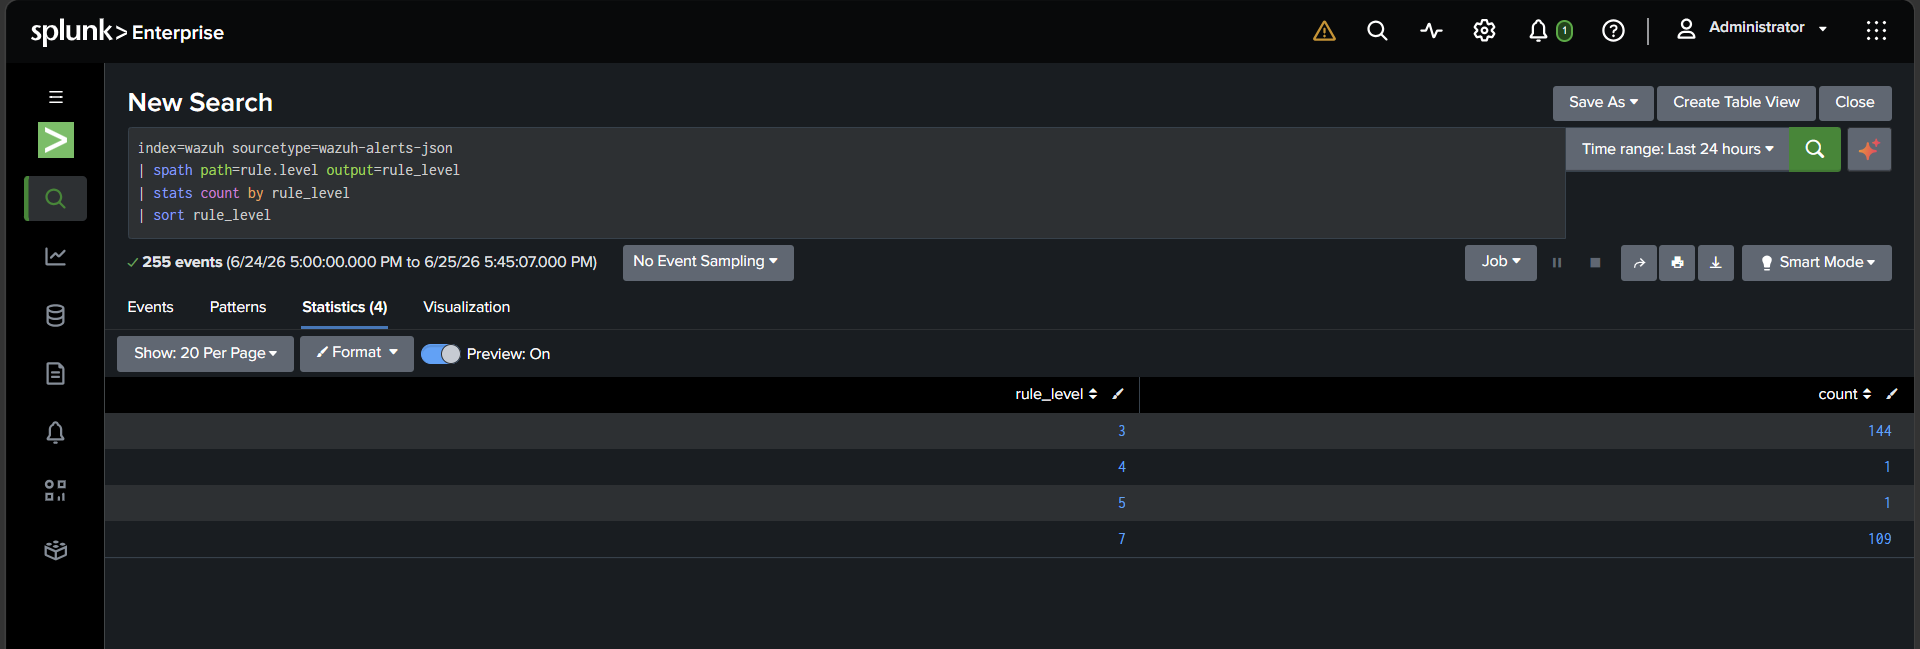
Count alerts by severity level:
index=wazuh | stats count by rule.level | sort -rule.level
Proof it worked
1. Wazuh Manager was running
2. Wazuh alerts arrived in Splunk
3. The Wazuh alert file existed on Ubuntu

4. Alerts counted by severity level — levels 3 (144), 4 (1), 5 (1), and 7 (109).
5. Common alert types — PAM logins, successful sudo to root, and CIS Ubuntu benchmark findings
What I learned
- Wazuh detects security activity.
- Splunk helps search and analyze alerts.
- The Universal Forwarder moves logs from one system to another.
- Port
9997must be open so Splunk can receive logs. - If there is no activity, there may be no alerts.
- Creating safe test activity is a good way to prove the pipeline works.
Project A of a 4-part security home-lab portfolio.